
OpAMP for OpenTelemetry Collector Fleets
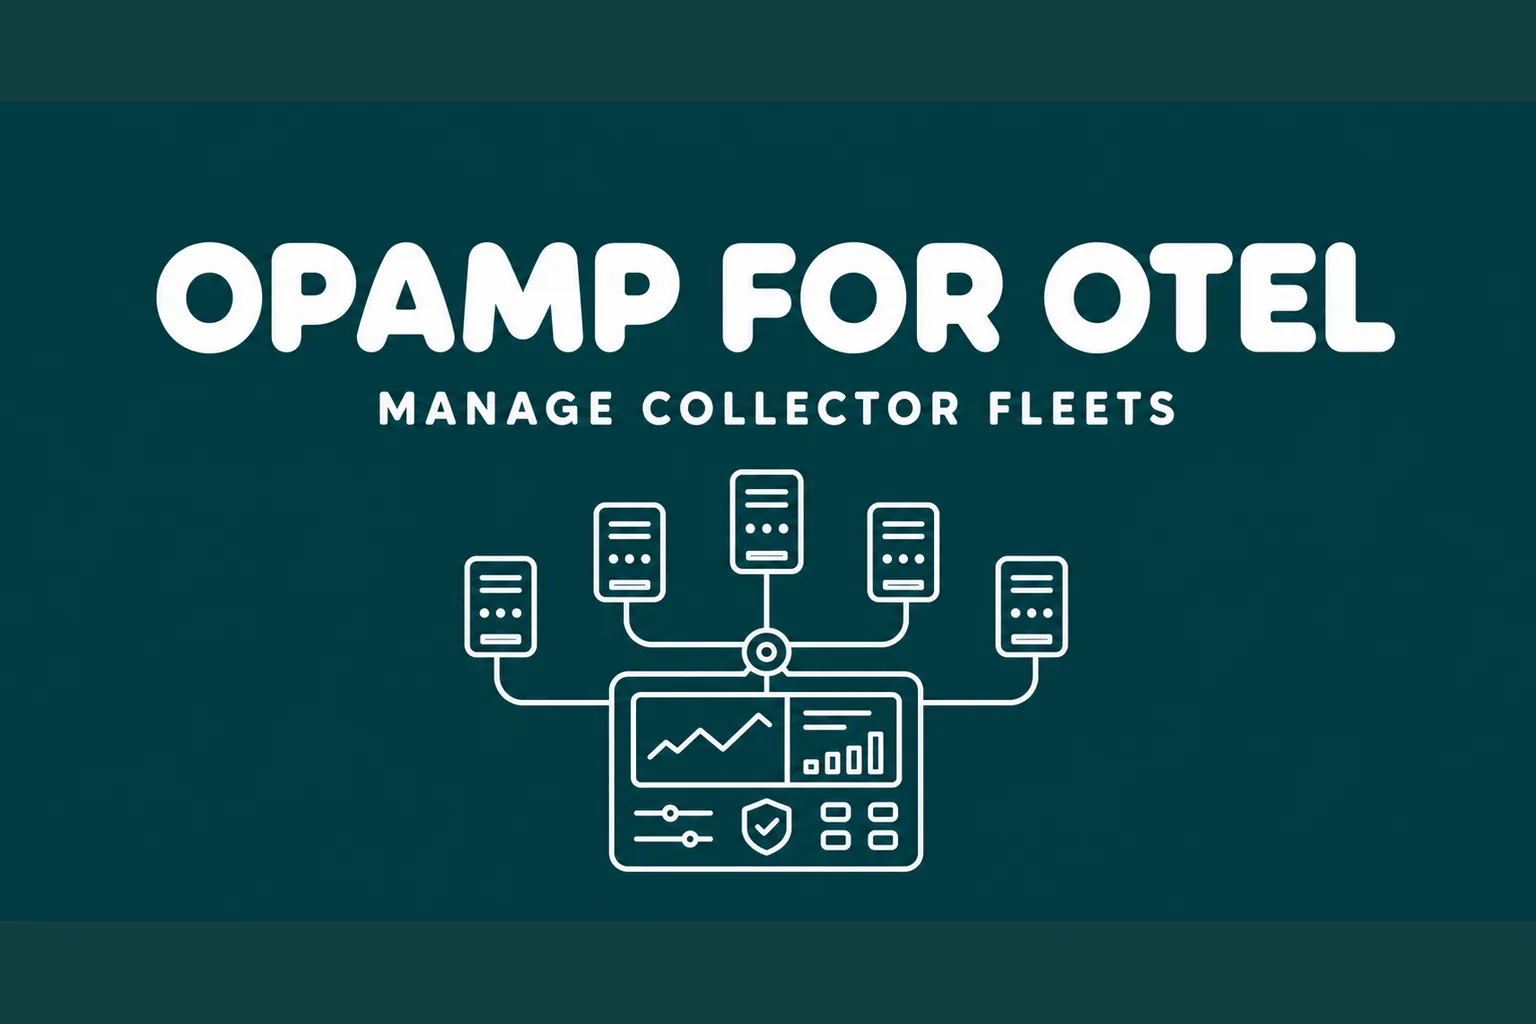
OpenTelemetry adoption usually starts with a few collectors. Then the fleet grows: DaemonSets in Kubernetes, gateway collectors, host agents, security pipelines, and test environments that all drift in different ways. A recent CNCF post on OpAMP is worth attention because it focuses on the operational layer that appears after instrumentation works.
What Is OpAMP?
OpAMP is the Open Agent Management Protocol. It is a client/server protocol for managing telemetry agents such as the OpenTelemetry Collector, Fluent Bit, SDK components, and other agents.
The protocol supports HTTP and WebSocket transport. An OpAMP server sits in the control plane, while an OpAMP client runs in or near the managed agent. The goal is simple: query state, push configuration, report health, manage versions, and handle connection details consistently.
For OpenTelemetry, this matters because collector health is production health. If the collector is silently dropping data, your incident timeline gets worse exactly when you need it most.
Key Features
- Remote configuration: push collector configuration from a central control plane instead of editing per-node files.
- Fleet visibility: report agent version, capabilities, status, and effective configuration.
- Health reporting: track CPU, memory, processing rates, backpressure, and collector-specific failures.
- Safer rollouts: use the OpAMP Supervisor to write config, restart the collector, and fall back to the last known good config if startup fails.
- Agent-neutral design: manage collectors today, then extend the same pattern to other telemetry agents when needed.
Installation
For a local test, use the official OpenTelemetry walkthrough. Start an example OpAMP server from opamp-go, install an OpenTelemetry Collector binary, then download opampsupervisor from OpenTelemetry Collector releases.
git clone https://github.com/open-telemetry/opamp-go.git
cd opamp-go/internal/examples/server
go run .
Then create a supervisor config that points at your collector binary:
agent:
  executable: /usr/local/bin/otelcol-contrib

storage:
  directory: /var/lib/otelcol/supervisor

telemetry:
  logs:
    encoding: console
Start the supervisor:
./opampsupervisor --config=supervisor.yaml
Operational Tips
Treat OpAMP as a rollout control plane, not a shortcut around change management. Store approved collector configs in Git, validate them in CI, then let OpAMP distribute known-good versions.
Separate read-only inventory from write-capable management. Some environments only need collector status and health. Others can accept remote config updates. Keep those permissions explicit.
Roll out by rings. Start with lab collectors, then one cluster, then a small production slice. Watch dropped spans, exporter queue length, memory, CPU, and collector restarts before widening the rollout.
Be careful with crash log snippets. The supervisor can include recent collector logs in failure reports, but those logs may contain sensitive data. Enable small snippets only where the incident value is worth the exposure.
Conclusion
OpAMP is useful because it makes the observability pipeline itself observable and manageable. For SRE teams running OpenTelemetry at scale, that can reduce drift, speed up incident debugging, and make collector changes less risky.
At Akmatori, we help SRE teams build intelligent automation that responds to incidents and manages infrastructure. For GPU-accelerated AI workloads, check out Gcore cloud infrastructure with global edge locations.