Compile-Time Go Telemetry with OpenTelemetry
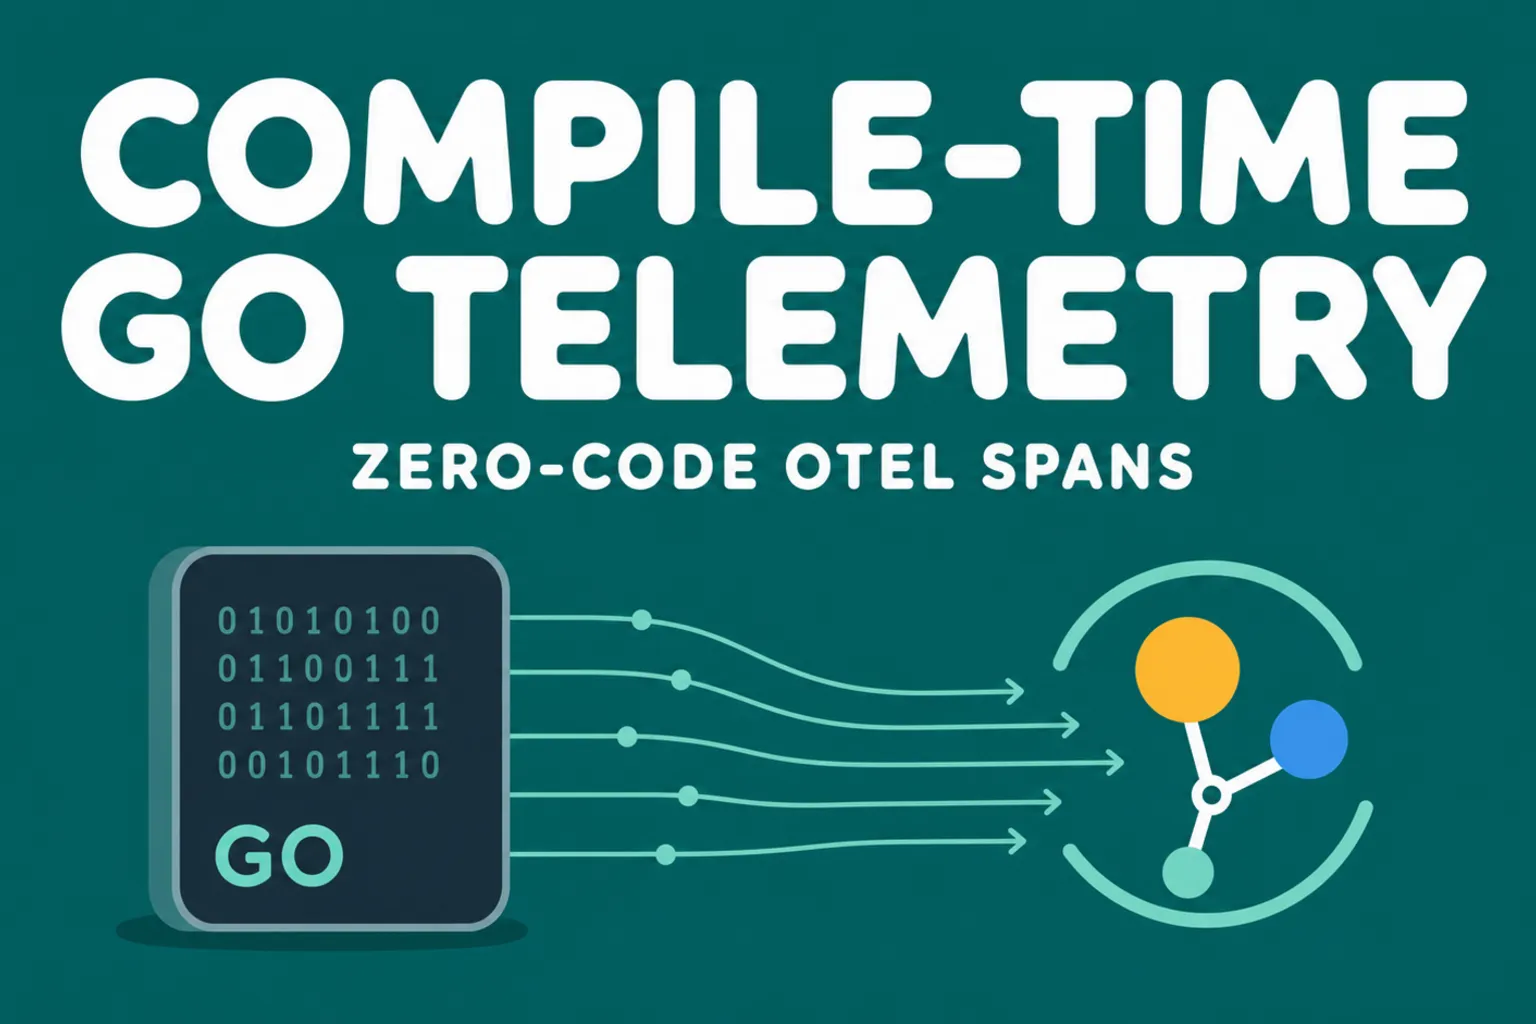
Go services often arrive in production with uneven tracing. One team instruments net/http, another wraps database calls, and a third-party library stays invisible until an incident exposes the gap. The OpenTelemetry Go Compile-Time Instrumentation project tackles that problem at build time.
What Is OpenTelemetry Go Compile-Time Instrumentation?
OpenTelemetry Go Compile-Time Instrumentation provides otelc, a build wrapper for Go applications. Instead of requiring developers to add tracing calls throughout the codebase, otelc modifies the Go build process and injects OpenTelemetry hooks into the compiled binary.
The operational value is straightforward: SRE teams get wider trace coverage without asking every service owner to refactor code. The project documentation describes support for net/http, gRPC, database/sql, Gin, Redis, MongoDB, k8s.io/client-go, Kafka, OpenAI Go SDKs, and Anthropic Go SDKs.
Why SRE Teams Should Care
- Zero-code rollout path: start collecting useful spans before a full instrumentation migration.
- Third-party library visibility: capture calls inside dependencies that your team does not own.
- CI-friendly integration: add
otelcto a controlled build job and compare instrumented artifacts before rollout. - Clean application code: keep telemetry policy near platform tooling instead of scattering it through business logic.
This is especially useful for internal control planes, incident bots, and platform APIs where Go services call Kubernetes, databases, queues, and LLM providers in the same request path.
Installation
The upstream quick start builds otelc from source:
git clone https://github.com/open-telemetry/opentelemetry-go-compile-instrumentation.git
cd opentelemetry-go-compile-instrumentation
make build
For Go 1.24 and newer, the getting started guide also shows a tool dependency flow:
go get -tool go.opentelemetry.io/otelc/tool/cmd/otelc
go tool otelc go build -o myapp .
Usage In CI
The simplest path is to prefix the normal build command:
otelc go build -o myapp ./cmd/api
If your build is hidden inside Makefiles or release scripts, use the toolexec mode instead:
otelc setup
export GOFLAGS="${GOFLAGS} '-toolexec=otelc toolexec'"
go build -o myapp ./cmd/api
That lets platform teams test compile-time instrumentation without rewriting every build target. Start with one service, export traces to a staging OpenTelemetry Collector, and compare span volume, cardinality, and request latency against the plain build.
Operational Tips
Treat this like any other production telemetry change. Pin the otelc version, keep instrumented and non-instrumented builds easy to compare, and roll out by service tier. Watch for unexpected span cardinality from database statements, Kubernetes resource names, or GenAI request metadata.
It is also worth pairing compile-time spans with clear incident automation boundaries. Telemetry can show what happened, but remediation still needs approvals, audit trails, and context-aware runbooks.
Conclusion
Compile-time instrumentation is not a replacement for thoughtful observability design. It is a practical way to close visibility gaps in Go fleets, especially when teams need useful traces before a long source-code migration finishes.
If you are building incident automation around Go services, Kubernetes APIs, and telemetry pipelines, Akmatori helps connect signals to controlled SRE workflows. Back it with reliable infrastructure from Gcore and your team gets a stronger base for production operations.