Code Mode for Agents: Batch Tool Calls, Cut Round-Trips and Tokens
An incident agent that checks twelve pods spends most of its budget on plumbing. It calls a tool, reads thousands of lines of output, picks the next tool, and pays for every line. Each step is a full model turn.
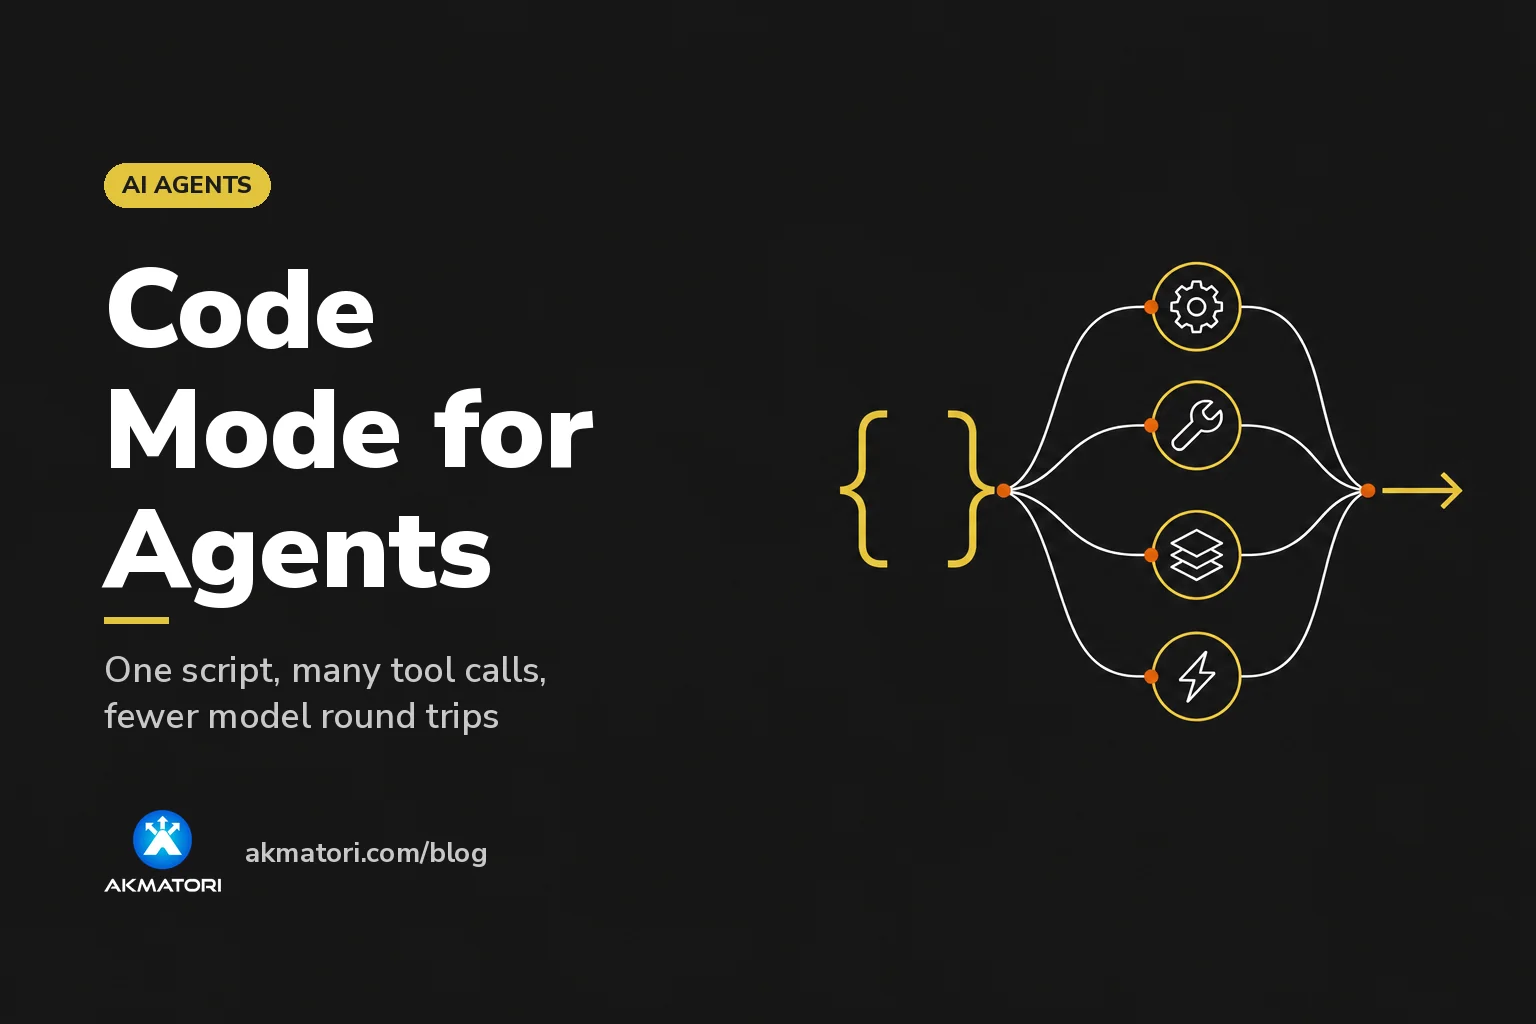
Code mode changes the unit of work. The model writes a short script, the runtime runs it, and only the script's output goes back to the model. Claude Code's Code Mode and pi's codemode tool both ship this pattern. Below: how it differs from parallel tool calls, where it fails, and how to measure it.
What Code Mode Is
The idea is older than either runtime. Cloudflare's Code Mode post from September 2025 put it in one line: "Convert the MCP tools into a TypeScript API, and then ask an LLM to write code that calls that API." Its argument: LLMs have seen a lot of code, but not many tool calls. In November 2025, Anthropic's Code execution with MCP named the two costs this removes: tool definitions that overload the context window, and intermediate results where "Every intermediate result must pass through the model."
The two runtimes implement it like this:
- Claude Code. "Claude writes a piece of JavaScript that makes the tool calls, and Claude Code runs that code in your session." The code runs through a tool called
REPL. What the code's last line returns goes back to Claude. The feature is experimental and off by default. You turn it on withCLAUDE_CODE_EXPERIMENTAL_CODE_MODE=1on v2.1.323 or later. It works only in the interactive terminal, not with-por the Agent SDK. - pi. The
codemodetool "lets the model write a JavaScript script that calls pi's other tools". The script runs in a QuickJS sandbox with "no Node APIs, file system, network, or timers". Every session tool, MCP tools included, is atools.<name>(args)function. Enable it withpi --tools +codemodeor"defaultTools": ["+codemode"]in settings. Settingcodemode.modeto"only"hides the built-in and extension tools so the model reaches them through scripts.
Anthropic's API has a server-side version of the pattern, programmatic tool calling. Claude writes code that calls your tools "within a code execution container, rather than requiring round trips through the model for each tool call."
Parallel Tool Calls Are Not the Same Thing
It is tempting to call code mode "parallel tool calls, run on the client". That is half right. The Claude API already does parallel calls: "By default, Claude may call multiple tools in a single response." And the client always ran the tools. What changes is how much work happens between two model turns.
| Sequential tool calls | Parallel tool calls | Code mode | |
|---|---|---|---|
| Calls per model turn | One | Several independent calls | Any number, including dependent ones |
| Call B uses output of call A | Next turn | Next turn | Same script |
| Loops and retries | One turn per iteration | One turn per iteration | A for loop in the script |
| What enters context | Every full result | Every full result | Only what the script returns |
| Who filters 10,000 log lines | The model, by reading them | The model, by reading them | filter() in the script |
| Visible to a reviewer | Each call | Each call | Each call, plus the code |
Parallel calls cut latency on fan-out. They do not cut tokens: twelve log dumps still land in the context. They also do not help when step two depends on step one. Code mode handles both, because control flow and filtering run as code, not as model turns.
The Numbers Vendors Publish
These come from vendor tests, not your workload.
- Anthropic's advanced tool use post reports average token use falling "from 43,588 to 27,297 tokens, a 37% reduction on complex research tasks" with programmatic tool calling. It also says a block of 20+ calls in code removes "19+ inference passes."
- The programmatic tool calling docs report that on BrowseComp and DeepSearchQA it "improved performance by an average of 11 percent while using 24 percent fewer input tokens."
- The code execution with MCP post walks through an example that "reduces the token usage from 150,000 tokens to 2,000 tokens". That figure comes from letting the agent load only the tool definitions a task needs, in one worked example, not an average.
Neither the Claude Code nor the pi page gives token or latency numbers. Measure your own.
Worked Example: Twelve Pods, One Error Spike
An alert fires: 5xx rate up on checkout. A normal tool loop goes like this:
- List pods for the deployment. One model turn.
- Fetch logs from twelve pods. With parallel calls, one turn. Twelve full log tails now sit in context.
- Fetch restart counts for the three noisy pods. Another turn.
- Query the error-rate metric around the deploy time. Another turn.
That is four model turns, and every later turn re-reads all twelve log tails. In code mode, one script lists the pods and fetches the logs with Promise.allSettled. It counts error lines per pod, gets restart counts for the top three, and returns a table and five sample lines. That is one turn, and the model reads a few hundred tokens instead of twelve log tails.
The script still runs every call. Code mode does not save tool calls. It saves model turns and context.
Where It Goes Wrong
The docs list several limits that matter for operations work:
- Side effects are real mid-script. pi says it plainly: "Tool calls are real: calls made before a failure are not undone." A script that restarts three pods and fails on the fourth has restarted three pods. Keep scripts read-only, or make every write idempotent.
- One failure can drop all results. In pi, a failed tool call rejects with an
Error. The docs suggestPromise.allSettled()so the calls that succeeded still count. - The sandbox is not where you think. Claude Code: "The JavaScript itself and its file, web, and MCP tool calls run outside the sandbox." Only shell commands follow your sandbox settings. pi runs scripts in QuickJS with no network, so tools and the
modelsglobal are the only way out. - Review sees less. In Claude Code auto mode, a classifier reviews the code, not each call, and it cannot see values computed at runtime. Each call inside the script still passes your
denyandaskrules andPreToolUsehooks under its usual name. To gate code itself, add"ask": ["REPL"]. - Hidden filtering hides evidence. If the script returns "no errors", the model cannot check how the script decided that. Make scripts return counts and samples, not verdicts.
How to Measure It in Your Agent
Pick five to ten real tasks with known answers, such as past incidents or repo chores. Run each with code mode off, then on, with the same model. Record five numbers per run:
| Metric | Where to get it |
|---|---|
| Model requests | Count of claude_code.api_request events |
| Input, output and cache tokens | claude_code.token.usage, split by type (input, output, cacheRead, cacheCreation) |
| Tool calls per script | toolsUsed in the REPL tool response |
| Wall time | Session start to final answer |
| Correct answer | Your known result |
For Claude Code, turn on OpenTelemetry export and log each REPL run with a PostToolUse hook:
export CLAUDE_CODE_ENABLE_TELEMETRY=1
export OTEL_METRICS_EXPORTER=console
export OTEL_LOGS_EXPORTER=console
export CLAUDE_CODE_EXPERIMENTAL_CODE_MODE=1
claude
{
  "hooks": {
    "PostToolUse": [
      {
        "matcher": "REPL",
        "hooks": [
          { "type": "command", "command": "jq -c '.tool_response.toolsUsed' >> /tmp/code-mode-calls.jsonl" }
        ]
      }
    ]
  }
}
For pi, each script result reports its wall time, and a // @options: first line caps output with max_output_tokens (default 10000).
Read the results with care. Count cached tokens separately: re-read context is often a cache hit, so raw input tokens overstate the plain loop's cost. Tasks with one or two tool calls gain nothing, and writing the script costs output tokens. Score accuracy too: a cheaper run that filters out the evidence is a regression.
Where This Fits in Akmatori
Akmatori agents already work this way for batch jobs. As the architecture docs describe, every tool call goes through gateway_call, and the generated connected-tools skill tells the agent: "For multi-step work, use execute_script with built-in gateway_call()." Every call reaches the same MCP Gateway, which checks the run's tool allowlist and loads credentials at call time. The skills docs explain that tools are not assigned per skill: the generated connected-tools skill lists every enabled tool for the run. Our post on MCP gateways in production covers why one choke point for tool calls matters.
Conclusion
Parallel tool calls run independent work in one turn. Code mode also chains, loops and filters without asking the model each time, and it returns only what the model needs. That makes it strongest on fan-out investigations and large outputs, and weakest on short tasks and scripts with writes. Measure model requests, tokens by type, and accuracy on your own tasks before you switch it on for everything.
If your team wants AI-assisted incident workflows that batch tool calls through one audited gateway, Akmatori helps SRE teams investigate alerts, coordinate response, and automate safe infrastructure actions. Powered by Gcore for global infrastructure reliability.