Track Network Connections with netshow: Interactive Network Monitoring

Troubleshooting network connectivity issues often requires parsing verbose netstat or ss output to identify which process owns a connection. Traditional tools display raw port numbers and IP addresses without context, forcing operators to cross-reference PIDs and service names manually. netshow modernizes network monitoring with an interactive terminal UI that maps connections to recognizable service names, provides real-time bandwidth metrics, and enables instant drill-down into process details.
What is netshow?
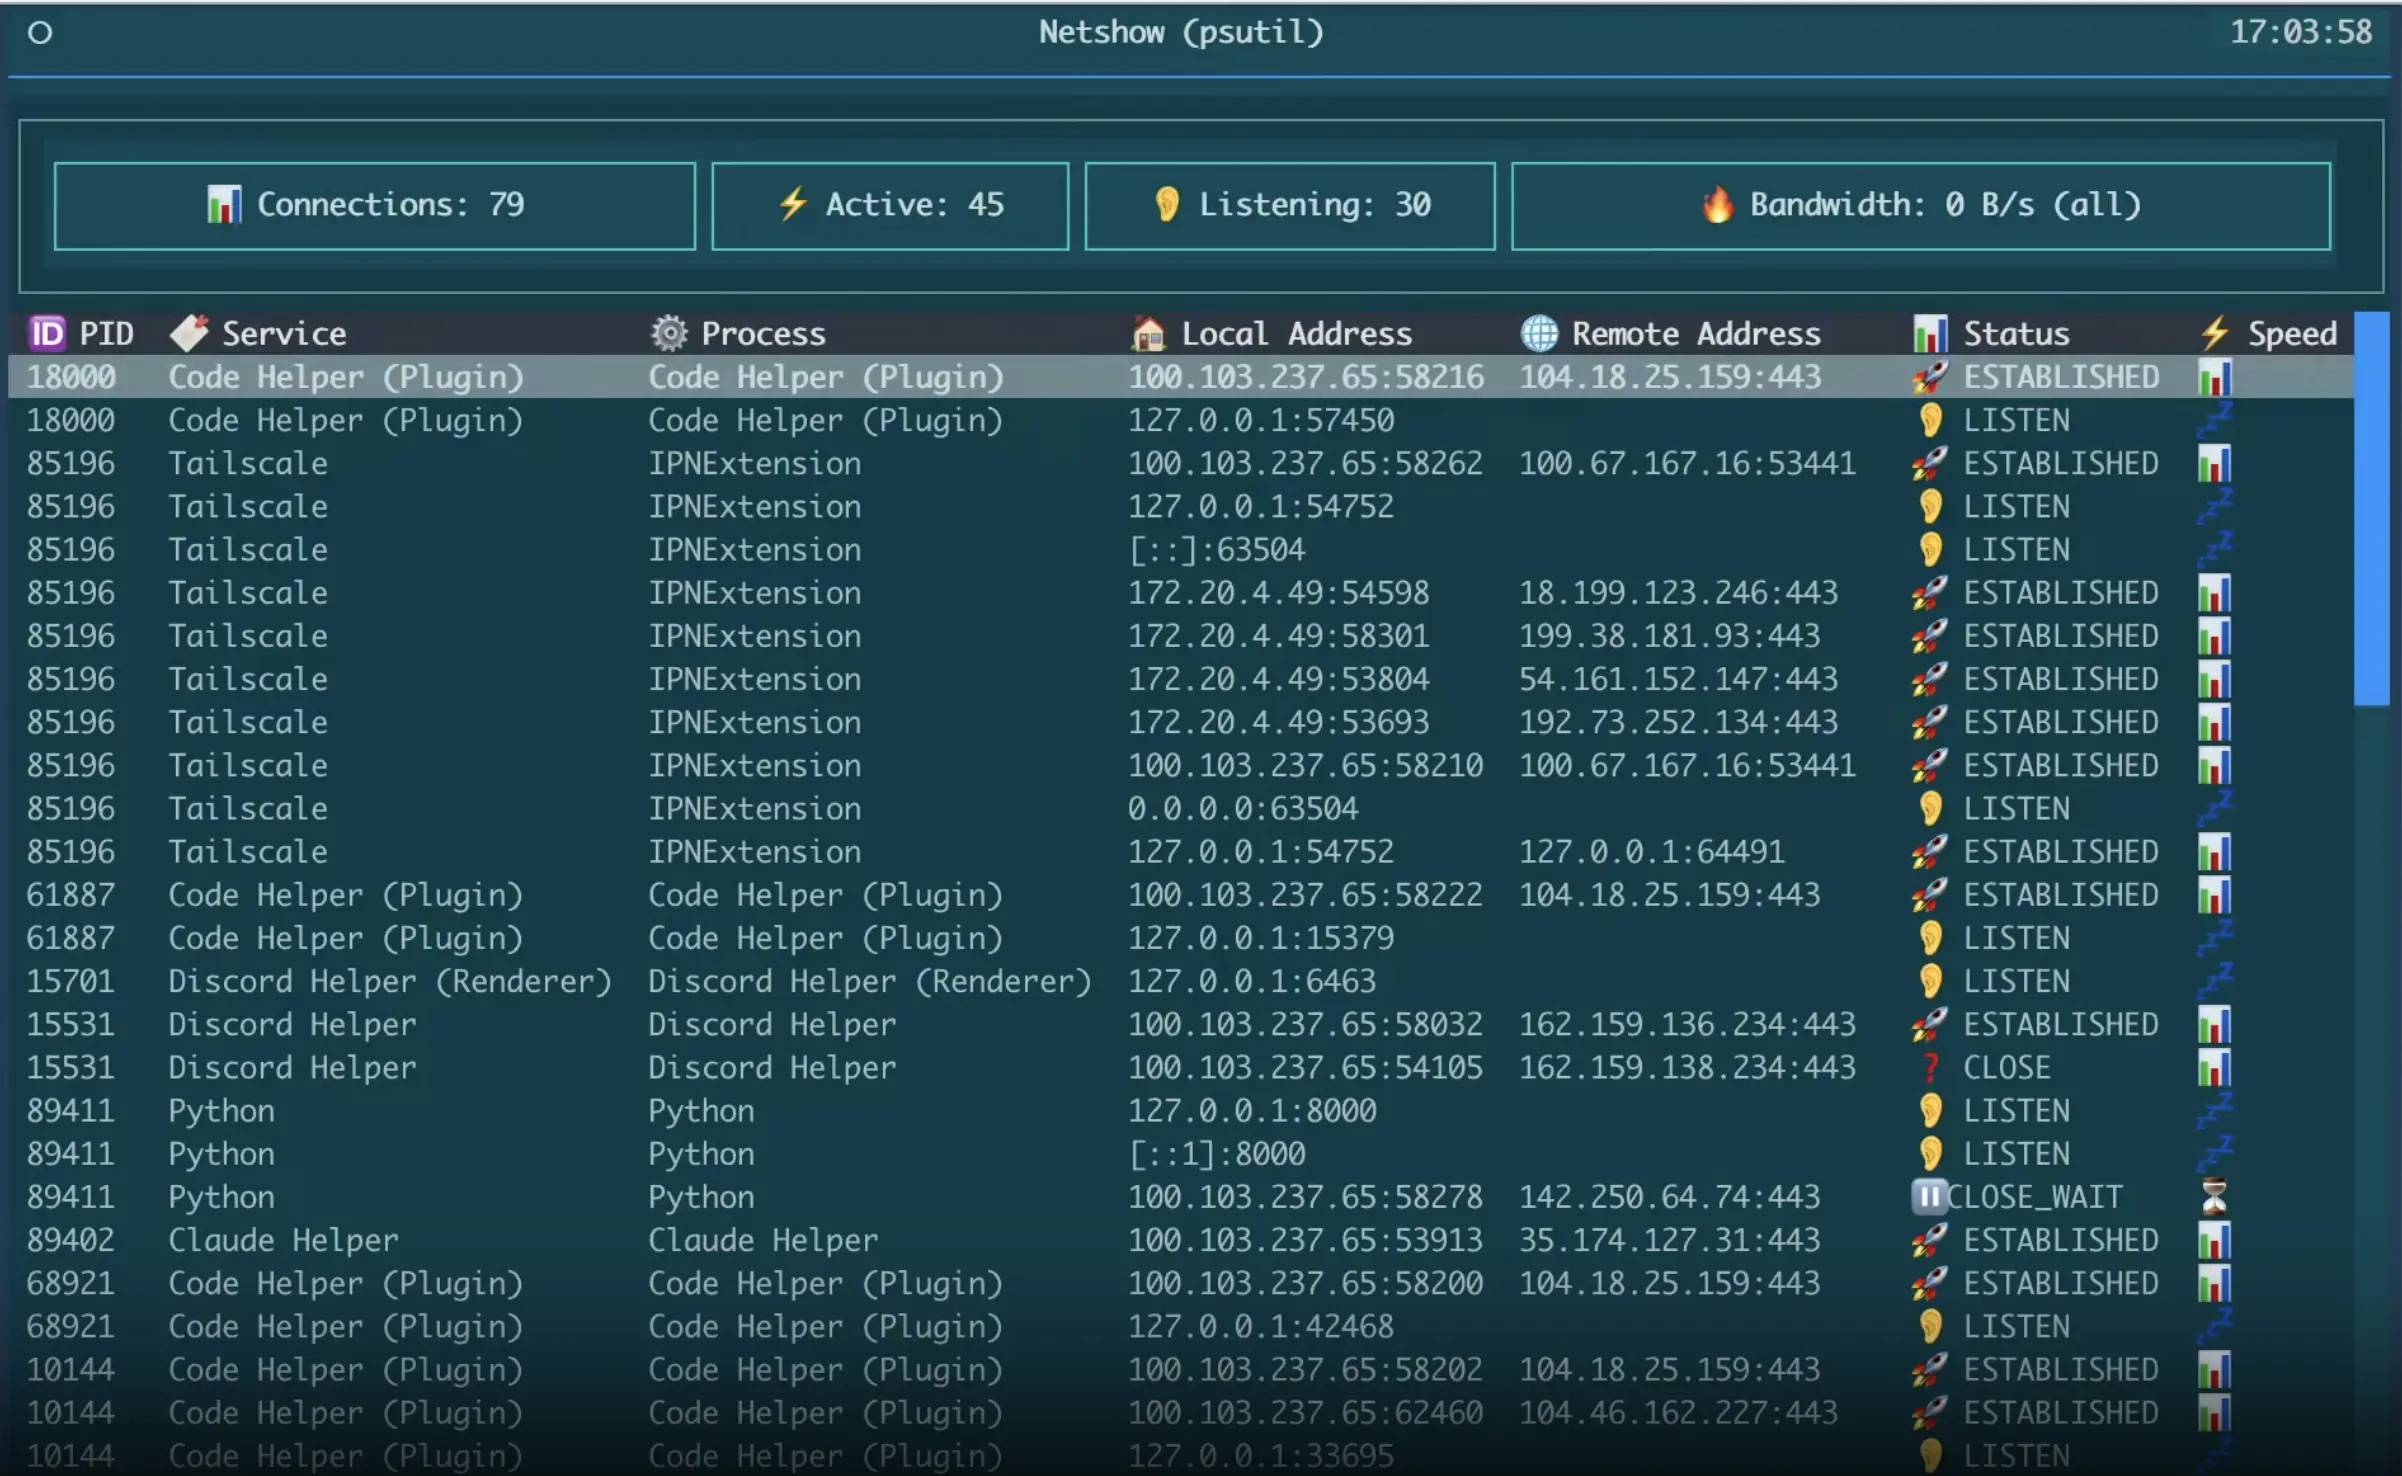
netshow is a Python-based network connection monitor that displays live TCP connections in a sortable, filterable interface. Unlike static command-line tools, netshow continuously updates connection states and translates raw network data into human-readable service names like "Docker," "VS Code," or "Plex." It runs with or without root privileges, adapting its backend to use psutil for comprehensive metrics or lsof when running unprivileged, making it suitable for both production troubleshooting and local development.
Key Features
- Human-Friendly Service Names: Automatically identifies and labels connections by application rather than port numbers.
- Real-Time Bandwidth Tracking: Displays per-connection and per-interface network throughput for spotting bandwidth hogs.
- Interactive Process Drill-Down: Click or press Enter on any connection to view full process details, command-line arguments, and parent processes.
- Advanced Filtering: Apply regex patterns to isolate specific services, hosts, or connection states during incident response.
- Optimized Performance: Handles thousands of concurrent connections without lag, suitable for busy production servers.
Installation
Install netshow using uvx for the simplest setup:
uvx netshow
Alternatively, clone and run locally with uv:
git clone https://github.com/taylorwilsdon/netshow.git
cd netshow
uv run netshow
For systems with Python 3.9+, install via pip:
pip install netshow
netshow
Usage
Launch netshow with default settings to monitor all TCP connections:
netshow
Customize the refresh interval or disable colors:
netshow --interval 0.5 --no-colors
Navigate the interface using keyboard shortcuts:
↑/↓— Move cursor between connectionsEnter— Open detailed process viewfor/— Toggle filter mode for regex searchs— Sort by connection status (ESTABLISHED, LISTEN, etc.)p— Sort by process namei— Cycle through network interfaces
Filter connections by typing a regex pattern after pressing f. For example, filter to show only Docker-related connections or traffic to a specific IP address.
Operational Tips
- Identify Bandwidth Abuse: Sort by throughput to quickly find processes saturating network links during performance degradation.
- Debug Service Connectivity: Filter by service name to isolate outbound connections from a specific application when investigating API timeouts.
- Run Without Root: Use
lsofmode in locked-down environments where elevated privileges aren't available—netshow gracefully degrades functionality. - Monitor Interface Stats: Cycle through interfaces with
ito verify traffic distribution across bonded or multi-homed network configurations.
Conclusion
netshow transforms raw network connection data into actionable insights with an interactive, visually intuitive interface. Its ability to map processes to services and track real-time bandwidth makes it essential for SREs diagnosing connectivity and performance issues.
For efficient incident management and to prevent on-call burnout, consider using Akmatori. Akmatori automates incident response, reduces downtime, and simplifies troubleshooting.
Additionally, for reliable virtual machines and bare metal servers worldwide, check out Gcore.