Monitor Containers in Real-Time with ctop: A Top-Like Interface for Docker
Tracking resource usage across multiple containers requires switching between docker stats, docker ps, and log inspection commands. For operators managing dozens of containers, this workflow becomes cumbersome. ctop consolidates container metrics into a single, interactive terminal interface modeled after the classic top command, enabling instant visibility into CPU, memory, network, and I/O usage.
What is ctop?
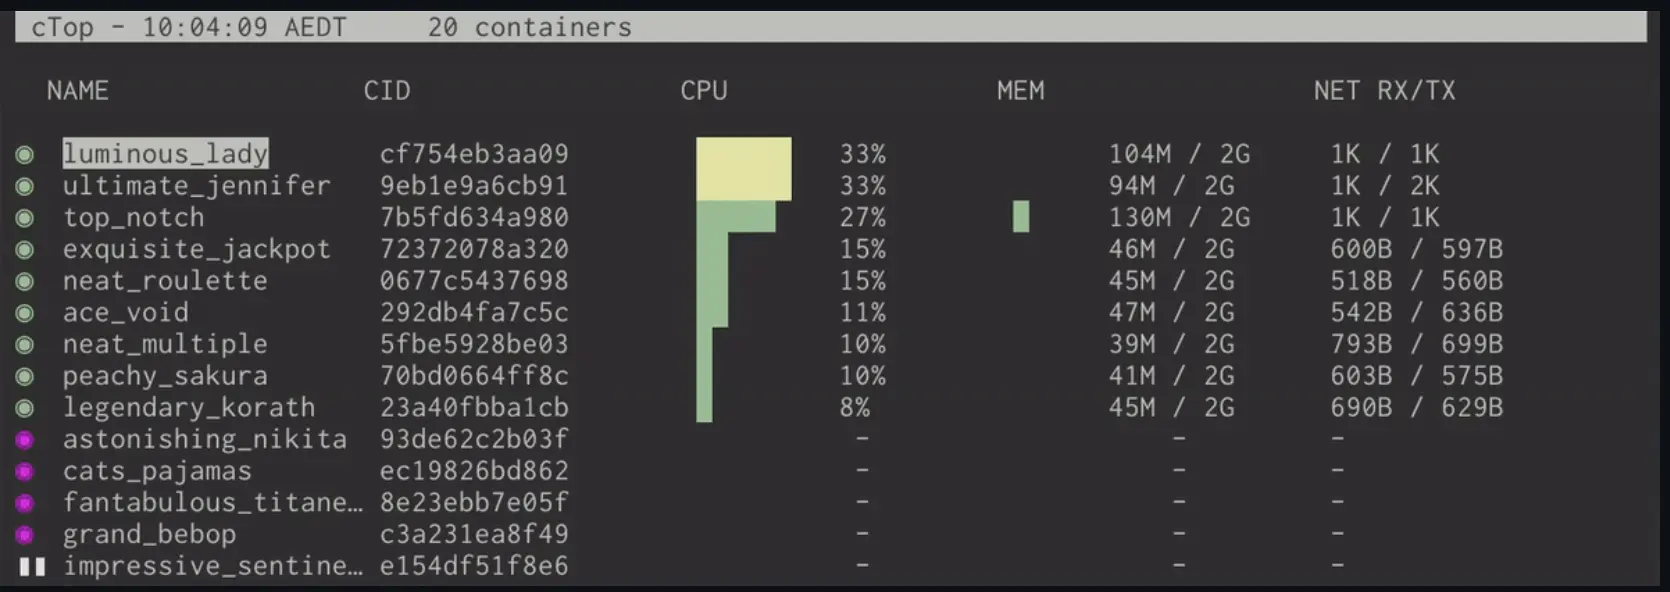
ctop is a lightweight command-line tool that provides a top-like interface for monitoring container metrics in real-time. It displays a condensed overview of all running containers with their resource consumption, status, and metadata. Built for Docker and runC environments, ctop eliminates the need to memorize verbose docker stats output by presenting metrics in a sortable, filterable grid view with interactive drill-down capabilities.
Key Features
- Real-Time Metrics Dashboard: Displays CPU, memory, network I/O, and block I/O for all containers in a continuously updating view.
- Interactive Controls: Sort by resource usage, filter by name or state, and toggle between running and stopped containers with single keystrokes.
- Single Container View: Drill down into individual containers to inspect detailed metrics, logs, and process information.
- Container Management: Execute shell sessions, view logs, start, stop, or remove containers without leaving the interface.
- Zero Configuration: Automatically connects to the Docker daemon using standard environment variables—no setup required.
Installation
Install ctop using your package manager or download a precompiled binary:
macOS (Homebrew):
brew install ctop
Linux (Debian/Ubuntu):
sudo apt install ctop
Linux (Arch):
sudo pacman -S ctop
Download Binary (Linux/macOS):
sudo wget https://github.com/bcicen/ctop/releases/latest/download/ctop-$(uname -s)-$(uname -m) \
  -O /usr/local/bin/ctop
sudo chmod +x /usr/local/bin/ctop
Run as Docker Container:
docker run --rm -ti \
  --name ctop \
  --volume /var/run/docker.sock:/var/run/docker.sock:ro \
  quay.io/vektorlab/ctop:latest
Usage
Launch ctop with no arguments to monitor all running containers:
ctop
Navigate the interface using keyboard shortcuts:
a— Toggle display of all containers (including stopped)f— Filter containers by names— Cycle through sort fields (CPU, memory, name, etc.)Enter— Open single container view for detailed inspectionl— View container logse— Execute shell inside containerr— Restart containerq— Quit ctop
To connect to a remote Docker host, set the DOCKER_HOST environment variable:
export DOCKER_HOST=tcp://remote-host:2375
ctop
Operational Tips
- Sort by Resource Hogs: Press
srepeatedly to cycle through CPU and memory sorting, quickly identifying containers consuming excessive resources during incidents. - Filter in Production: Use
fto filter by container name prefix when running multiple microservices, isolating specific application tiers. - Combine with Scripts: Pipe
docker psoutput into automation scripts while using ctop for manual inspection—both tools complement each other. - Monitor Remote Hosts: Point ctop at staging or production Docker hosts via
DOCKER_HOSTto troubleshoot without SSH multiplexing.
Conclusion
ctop streamlines container monitoring by consolidating metrics and management commands into a single, responsive terminal interface. Its minimal resource footprint and zero-configuration design make it ideal for SREs troubleshooting containerized workloads under time pressure.
For efficient incident management and to prevent on-call burnout, consider using Akmatori. Akmatori automates incident response, reduces downtime, and simplifies troubleshooting.
Additionally, for reliable virtual machines and bare metal servers worldwide, check out Gcore.